(How to Recognize, Classify, and Validate Common Logic Structures)
It is not by accident that all decision models look similar. The similarities reflect the rigor of The Decision Model principles, the most important being mandatory adherence to Decision Model First Normal Form. These similarities are useful because they make it easy for people to understand and validate decision models, as there is only one way to interpret one. This is a major advantage of The Decision Model over other approaches for representing business logic.
However, this month we focus, not so much on the similarities among decision models, but on their differences. More than that, we explore the idea of classifying decision model structures based on differences in their logic.
Below, Part 1 summarizes the similarities among decision models. Part 2 does the same for their differences. Part 3 introduces three fundamental Rule Family classifications so you can recognize them and use them for validating business logic.
Part 1: Similarities among Decision Models
The similarities among Decision Models are evident in its two visual representations. The first is the decision model diagram. The decision model diagram reveals the structure of Rule Families and inferential relationships among them. Figure 1 contains three decision model diagrams. The second visual representation is the Rule Family table. The Rule Family table discloses the detailed content of the logic within a Rule Family as shown in Figure 2.
At a glance, Figure 1 and Figure 2 expose six visible similarities. Specifically, every decision model diagram has exactly one decision Rule Family, zero to many supporting Rule Families, and zero to many inferential relationships among supporting to dependent Rule Families. Further, every Rule Family table has exactly one conclusion fact type, zero to many condition fact types, and one or more Rule Patterns. What about the visible differences?
Part 2: Differences among Decision Models
The decision model diagram is the first place to look for visible differences among decision models. The three decision model diagrams in Figure 1 are all similar with respect to the six characteristics above. Yet, some differences are immediately obvious. These differences reflect the nature of the logic within the models.
In Figure 1, one decision model has six Rule Families, another has five, and another has thirteen. Looking only at decision Rule Families, two have three condition fact types, and one has four. Comparing levels of Rule Families, two have three levels and the other has two. Looking again only at decision Rule Families, the top left model has two condition fact types between the solid and dotted line and one below the dotted line. On the other hand, the top right model has all four condition fact types between the dotted and solid line.
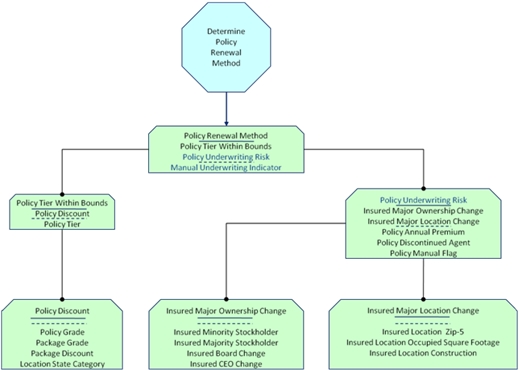


Figure 1 : Three Different Decision Model Diagrams
Therefore, Figure 1 illustrates that decision model diagrams may differ in the following:
- Quantity of Rule Families
- Quantity of conditions per rule Family
- Different levels of supporting Rule Families and
- Placement of condition fact types above and below the solid and dotted lines.
However, there are additional differences that are only visible in the populated content of the Rule Family tables. Part 3 explores these kinds of differences.
Part 3: Three Fundamental Rule Family Classifications
One of the most important differences within Rule Family tables is the cardinality of the conclusion reached. The cardinality of the conclusion reached is simply how many Rule Family rows can evaluate to true for any set of input values. Three different conclusion cardinalities show up in practice often and are worth exploring:
- Classification #1: Only One Row Evaluates to True
- Classification #2: Multiple Rows Evaluate to True but Produce the Same Conclusion Value
- Classification #3: Multiple Rows Evaluate to True but May Produce Different Conclusion Values
Classification #1: Only One Row Evaluates to True
In this kind of Rule Family only one row can ever evaluate to true for any input. This is the most common kind of Rule Family. An example is in Figure 2.
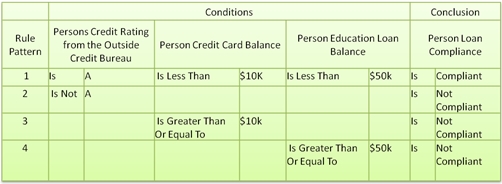
Figure 2 : Classification #1
Rule Families of Classification #1 result in a conclusion value based on mutually exclusive rows (Hence, only one row can evaluate to true for any input). Sometimes, the domain values for the conclusion fact type are a set of values such as {high, medium, low} as is the case in Figure 2. Sometimes it is a set of codes, such as {A, B, C}.
Validating a Rule Family of Classification #1 means ensuring full domain coverage for all fact types and eliminating overlaps among logic in rows so that only one row evaluates to true for any set of input values.
Classification #2: Multiple Rows Evaluate to True but Produce the Same Conclusion Value
In this kind of Rule Family, more than one row can evaluate to true for any input, but all such conclusion values are the same. A simple example is in Figure 3.

Figure 3 : Classification #2
Rule Families of Classification #2 usually have a conclusion fact type with two domain values where one value is a desired one (e.g., “compliant”) and the other is the opposite or undesired one (e.g., “not compliant”). The important characteristic of Classification #2 is that the Rule Family may conclude either value more than once for a given input. For example, several rows may evaluate to true and all of them conclude that the input is compliant. Alternatively, several rows may evaluate to true and all of them conclude that the input is not compliant. However, several rows cannot evaluate to true where some conclude that the input is compliant and others conclude that the input is not compliant.
Sometimes, the domain for the conclusion fact type is a set of {compliant, not compliant}, sometimes a set of {true, false}, and sometimes a set of {yes, no}.
The most common example of this kind of Rule Family is a simple one as in Figure 3. This Rule Family contains only one row leading to the desired conclusion value (in this case “compliant”). To be complete, this Rule Family also includes rows leading to the undesired conclusion value (in this case “not compliant”). Examining Figure 3, input values of Person’s Credit Rating of B and Person’s Credit Card Balance of $10k will result in two rows evaluating to true, hence two “not compliant” conclusions. This situation is perfectly acceptable if the Rule Family is Classification #2.
Validating the content of Classification #2 means ensuring full domain coverage for all fact types, ensuring the correct rows lead to the desirable conclusion value, and ensuring there are rows for all other conditions leading to the undesired conclusion value. (The latter usually requires separate rows to accommodate Ors.) In addition, it means ensuring there are no overlaps by which both the desired and undesired conclusion values are possible.
Classification #3: Multiple Rows Evaluate to True but May Produce Different Conclusion Values
In this kind of Rule Family, more than one row can evaluate to true for any input and the conclusion values may be different. We refer to these as “multi-hit” Rule Families.
In Figure 4, the Rule Family determines the Student Financial Packages for which a student is eligible. Apparently, there are four kinds of financial packages: 20% scholarship, 30% loan, 20% work-on-campus opportunity and 5% work-on-campus opportunity. However, inspection of the logic reveals that there are overlaps among some rows. For example, a student with a GPA greater than 3.0 and with a membership in the national honor society is eligible for the 20% scholarship and a 30% loan. This situation is perfectly acceptable if the Rule Family is of Classification #3 and will return a set of two different conclusion values.
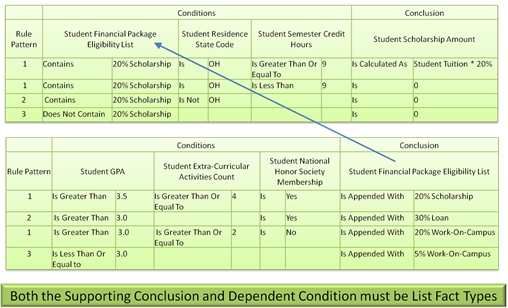
Figure 4 : Classification #3
Validating the content of Classification #3 means ensuring full domain coverage of all fact types and making sure the conclusion fact type name contains the word “List.” “List” indicates that the Rule Family permits a conclusion being a set of different conclusion values. In addition, validating it means ensuring the operator in the conclusion cell is set-oriented (in this case, “Append With” indicating that each conclusion value for a row evaluating to true becomes a member of the conclusion set of values). It is difficult to validate Classification #3 because it permits overlaps in logic. Other than checking with business people, there is no easy way to find incorrect logic.
If the conclusion in a Classification #3 Rule Family serves as a condition in another Rule Family, validation includes ensuring the operator in the dependent Rule Family is set-oriented. In Figure 5, this operator is “contains.”

Figure 5 : Dependent Rule Family Using a List Fact Type
How Do Rule Family Classifications Help?
This column pointed out how and why all decision models, by principle, look similar. The rigor of the principles leads to consistency among models, which, in turn, makes it easy for business experts to interpret and validate decision models developed by different people. The differences among decision models, however, are of great interest. It is worth exploring the most commonly occurring differences to understand how the corresponding logic behaves and how to validate it.
The focus of this column is on one specific kind of difference: the cardinality of possible Rule Family conclusion values. Table 1 summarizes its three common classifications.
As experience with The Decision Model grows, other useful classifications of decision model structures will likely emerge. They may be as simple as the ones in the column. On the other hand, they may be as complex as classifications that are common within a particular industry. Eventually, we should see the emergence of entire decision model structures for specific industries.
| Classification # and Name | Classification Description | Figure Containing an Example | How to Validate |
| 1 Conclusion Cardinality of One |
Only one row in the Rule Family can evaluate to true for any input | Figure 2 |
|
| 2 Conclusion Cardinality of More than One but Same Value |
More than one row can evaluate to true for any input, but all such conclusion values are the same | Figure 3 |
|
| 3 Conclusion Cardinality of More than One but Different Values |
More than one row can evaluate to true for any given input and the conclusion values may be different | Figure 4 |
|
Table 1 : Summary of Three Rule Family Classifications
A Classification #2 Rule Family may have more than two possible conclusion values and may have more than one row evaluating to true for the “desired” but the example shown is the most common.


