A SOA implementation roadmap can be long and the SOA infrastructure, like “plumbing”, can be hidden from the end user during construction. During our SOA implementation, we used an “Early SOA” approach, where we connected a “faucet” to the SOA infrastructure and helped users “tap into” the value of the SOA infrastructure being built. Most Enterprises have Data and Processes with location attributes. We leveraged the SOA Infrastructure to transform Enterprise Data and Processes into an Open Geo Visualization Standard like KML[1] or GML[2]. This allowed the ESB/Intermediary to act as an “Application Server”, serving Enterprise Data & Services as Geographic Content, thus allowing the user to experience the benefits of SOA faster.
The laundry list of items required to get SOA done can be long, like defining Service Interfaces, Securing the Service Interfaces, creating a Data Model, creating a Governance & Management Framework, creating the Service Compositions and Orchestrations and much more. While some of these activities are taking a significant amount of time, the adoption of an incremental Data Service Layer and an ESB was done early on. We used these components to help create a generic solution which allowed users to Geo Spatially visualize Enterprise Data, allowing them to better understand and make better decisions from the situational attributes of data.
We wanted to ensure that the Business Sponsors got value out of their initial investment and hence stayed the course with use, while we were building the SOA framework. The Conceptual model of the solution is as follows
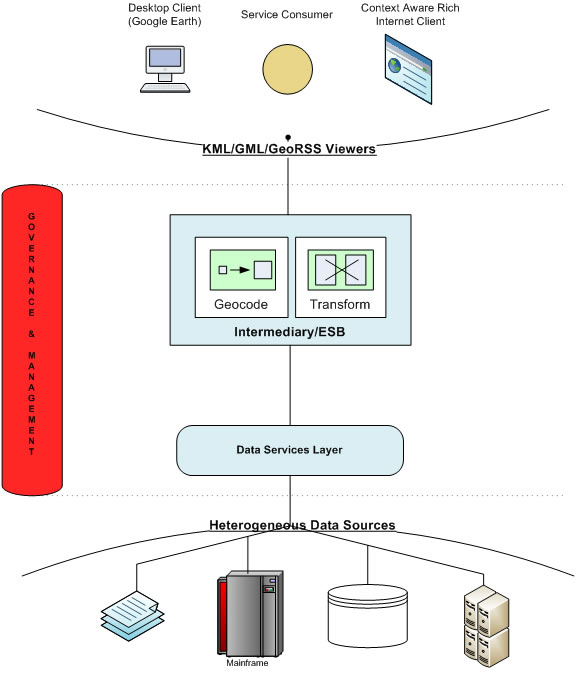 |
Figure 1
Data Services Layer
In the “House of SOA”, data is the “foundation”. Hence, in a SOA implementation roadmap, one of the initial activities is the creation of a Data Services Layer, which provides a Unified, Standards based access to different data sources (Databases, Business Intelligence, Flat files, and spreadsheets). With the proper SOA Governance and SOA Management, a Data Services Layer can provide a controlled and safe access mechanism to data stored in heterogeneous data sources.
Using the SOA infrastructure
After the Data Services Layer is up and running, the next step is to create a SOBA (Service Oriented Business Applications)[3], by consuming the Data Services and other Business Logic Services to create a new a composite service, which in turn can be a part of a Business Process.
We used a pattern which allowed another Service (Data or Composite) containing location attributes to be Geo-Spatially Visualized via an Open Standard like KML or GML. The formula is simple: Take data accessible via a Service, represented in a standard format (SOAP or REST), enhance it with Geographic Co-ordinates (Latitude and Longitude) and create a new Interoperable Visualization Service which is more useful than the sum of its parts.
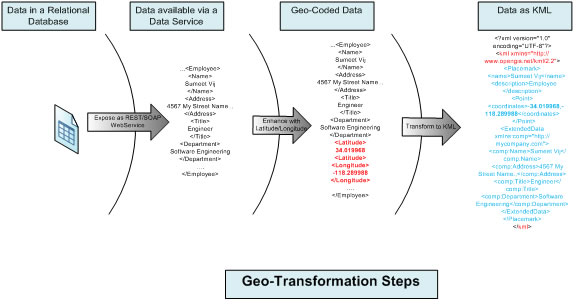 |
Figure 2.
Giving SOA a Face
In our SOA Roadmap, we espoused “SOA Visualization” as early as feasible. It helps to put a visual face to SOA and make SOA real.
SOA is plumbing, and however well it may be implemented, in the short run, business end-users care more about the “faucets” than the “plumbing”. Enterprise Mashups help deliver some of the value of SOA, Integration, Agility and Business Empowerment, much earlier in the SOA implementation roadmap. Most SOA practitioners advocate an iterative SOA delivery roadmap, Geo Visualization helps the Business User “see” the value in each iteration. As this pattern outputs data conforming to an Open Standard like KML/GML, Business Units now can “share” this interoperable data with other Business Units.
Presenting SOA
In our current iteration, we have chosen KML as the Geo-Visualization Standard. KML started off as a Google backed project, but now it is an Open Geospatial Consortium [OGC] standard. For our usage, KML provides an XML grammar for expressing geographical features. Given the wide popularity and easy availability of Google Tools (Google Earth, Google Maps, Google Maps API), we felt that the generated content will be more easily disseminated via KML.In addition to the Google Tools, we also created a Context Aware KML Visualization Client Application. This client application can render standard KML and can also be configured to be KML context aware in the sense that the user can include reference to extra HTML files which understand the data in the <ExtendedData>[4] element. Thus by default the KML Visualization client will display <Placemark> [5] on the map (the pushpins that we all see on Google Maps) and display the data in the <ExtendedData> in a spread-sheet type “data grid”. However, user configured HTML can display this data as graphs, charts etc, providing a “richer” view than the default.
Benefits/ROI of SOA based Geo Visualization:
- Created Reusable IT Components: Each layer in the Architecture has been designed to be agnostic to the other layers and is agnostic to a specific business context, hence promoting re-use.
- Data Layer: This layer supports exposing selective data in a controlled and secure manner without having to open up databases over networks. These Data Services are accessible and usable by multiple applications or business processes.
- Utility Services: The Geo-Coding Service is a reusable service which can be used to return the Latitude Longitude of any location. This service is deployed as a Proxy to the real Geo-Coding service. This allows us to keep the same interface to the calling services while changing the actual Geo-Coding provider service to Google or Yahoo or any other Geo-Coding Service of choice.
- KML Transformation Service: The KML Transformation service can be parameterized with the XLST file name specific to the source XML data. Based on the input data and its corresponding XSLT file, it can transform the source to KML.
- Client Application: The Context Aware KML Visualization Client Application can be used as a general purpose KML viewing tool or it can be “aware” of the <ExtendedData> element to render richer viewing experience. Hence we can overlay multiple KML feeds on the same map
- Achieved Intrinsic Interoperability: Interoperability is a natural by-product of applying Service-Orientation Design Principles [6]. As Services are designed from the ground up to follow consistent design principles and standards, they are natively able to exchange data with each other without requiring any extra effort towards “integration”.
- Increased Business Agility and Reduced Cost to deliver new functionality: As noted above, the different layers are re-usable and can be used to Geo-Visualize data from any source. This allows IT to respond faster to requests for change. Hence Data from Personnel database could be “mashed” up with data from the Facilities database and the Vehicles database to better visualize all three and make better decisions faster. This can be extended to data from outside the Enterprise, say a Weather Service, to see the impact of say a Hurricane on Personnel, Facilities and Vehicles.
- Increased collaboration with Partners: This is a consequence of Intrinsic Interoperability, as the Geo-Transform outputs data in an Open Standard, it can be consumed by Partners either by directly accessing the service or via a periodic download of the KML file. This allows partners, say the Suppliers of the Enterprise to visualize the various facilities and better plan their deliveries.
References:
[1]KML [OpenGeoSpatial:KML][2]GML [OpenGeoSpatial:GMLl][3]Mashups and SOBAs: Which is the Tail and Which is the Dog?[ZapThink Report][4] ExtendedData, KML Reference [Google KML Reference][5] PlaceMark, KML Reference [Google KML Reference][6] SOA: Principles of Service Design by Thomas Erl, ISBN: 0132344823, Prentice Hall/PearsonPTR


