Do you know how each process is performing right now in your organization? And if you’ve improved a particular process do you know if you achieved the level of improvement you wanted? It’s necessary to quantify data to be able to answer these two questions and provide objective ways to measure process and level of change.
So if you’re working on a single business process improvement project or many processes across the enterprise, you need a measurement system. But how do you build one that is comprehensive, efficient and effective?
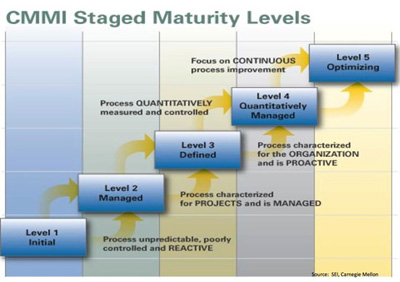
Where do you start? You have to start from where you are, so the Process Maturity Framework can help identify where on the continuum your organization is. The first graphic below shows the five levels of the CMMI Process Maturity Framework, with descriptors at each level.
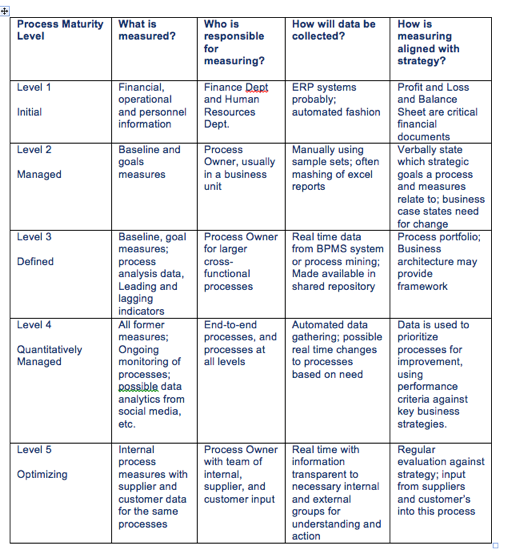
The second graphic shows how data and measures contribute at the different levels.
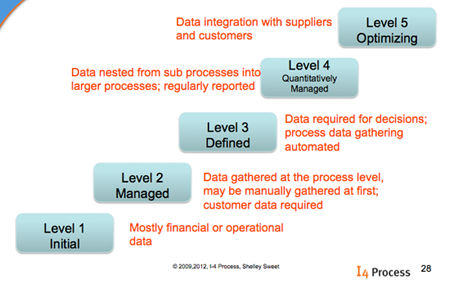
As the graphic depicts, at Level 1, the measures are financial and operational, numbers that are needed to record how the business operates. There is probably employee data as well. But there is probably only anecdotal process data.
At Level 2, as the organization recognizes process and begins to do process improvement projects, it is critical to establish the basics of a measurement system. This measurement system would start with data which provides quantitative information about how the process is currently working, what I call baseline data. This data is likely to be about time, quality/defects, volume, costs, productivity or customer satisfaction. The business process improvement (BPI) team needs to gather one to two output measures for each improvement target in the charter (Read more about the charter in my book, The BPI Blueprint: A Step-By-Step Guide to Make Your Business Process Improvement Projects Simple, Structured, and Successful) which will show the current health of the process—namely, how is it performing today. Once this initial data is gathered, the Process Owner can set goal metrics, or metrics he wants to meet after the process is analyzed and improved. In the process analysis phase, the BPI team gathers additional data to see where the biggest problem areas are, and then figures out how to improve steps or subprocesses for these problem areas. At Level 2 the data is all about understanding and improving individual processes, and identifying measures that are relevant to the process being studied.
It is often not easy to gather data at Level 2 as the data may have to be collected manually – from observing situations, by looking at emails and seeing where they start and go for workflow, by noticing the time stamps on emails, or from mashing together reports developed for another reason, but containing useful data. It is not likely that the process data needed will be readily available because process data has not been as important as financial and operational data.
At Level 2 it is also critical to collect voice of the customer data as well as internal process data. The customer is the person who receives or uses the output of the process. It can be an internal or an external customer. Without customer data the team is staring at its navel, and is missing a bit part of feedback from this stakeholder.
By Level 3, the organization should have already modeled and improved many processes (mostly within functions, but also some cross functionally.) Now they are ready to work with larger enterprise processes and to set up governance at the organizational level. What that means for measures is standards need to be agreed for how many and what type of quantitative data needs to be collected, analyzed and monitored for each process. One of the challenges is to choose the right process measures–measures that give insight toward the improvement targets for the process and measure what the company will use to make decisions and take action. I suggest these data elements are required for each process – baseline and goal data for each improvement target, in process measures for critical waste areas, voice of the customer, and other categories (time, quality, cost, productivity, or volume) depending on the focus of the goals.
Three other aspects of a measurement system become important at Level 3- automating measures, a process portfolio, and process measurement ownership.
(1) It is necessary to start thinking about how to collect the measures and move toward automating that data gathering. This means the company will probably be using a BPM suite or have data mining capabilities.
(2) Since this level is about the organization as a whole, there needs to be a process inventory and process portfolio. The process portfolio shows all the core processes, management processes, and infrastructure processes. This is a picture of the processes enterprise-wide, what I call a macro map.
A business architecture graphic will reveal even more than the macro map – adding related information systems, business strategy, and technology systems. What’s important with both the process portfolio and business architecture is that the company is looking at all its processes, noting duplications, and seeing which processes are important from a company perspective vs. a single leader or business unit need.
(3) The Process Owner is designated as the person responsible for continuing to monitor a process and follow the measures. A Process Owner was identified for each process at Level 2, but now at Level 3 this role is recognized at an organizational level. It should become part of job descriptions where appropriate. Also Process Owners will probably be part of a Steering Committee looking at measures across processes and the organization. Level 3 is really about moving from individual projects to organizational process maturity.
At Level 4, the organization is really using this measurement system in a regular and consistent fashion. It is measuring all the processes, and continuing to monitor any processes that have been studied and improved or transformed. It should have KPI measures related to process measures, and process measures available at different levels in the organization so that executives see the top level measures, senior managers know what they are responsible for (by process), middle managers know how their areas impact key measures and process, and the employee has certain measures to watch to see how processes are performing. And managers and employees can see how measures work in cross functional enterprise processes, beyond their sphere of control. Of course that also means that there are escalation methods that bring attention and action when a measure says the company needs to do something to keep the process working. The Process Owner is still the main person in charge, but sub process owners and employees know how they contribute and what they can impact.
At Level 4 data analytics from a wider source of data can be combined to give better decision making capability, even predictive analysis. Social media data may be included; and if a BPMS system is used, it may be possible to change the process and impact the process real time as data triggers particular needs.
There needs to be a system to measure one process against another (and one subprocess against another) and a method of selecting which processes to work on next. The process portfolio should be evaluated quarterly using performance criteria and against the enterprise strategy. Process projects (large and small) should not be initiated without this vetting—asking is this the right process to be working on now, do we have the right resources, what other processes will be impacted?
Level 5 – Optimizing is the highest level and means that the measurement system (as well as several other aspects of the Process Maturity) are working at the top level. So process measures are a regular part of daily operations with employees and managers using the data to inform their decisions and action. What is added at Level 5 is that suppliers and customers should be included in the processes. For measures this means company data is shared with suppliers and customers and vice versa, and all use the data and measures daily and in regular reviews. That means the shared data is transparent for the needed parties. This is clearly a much wider and more open information system.
Below is a table which gives measurement elements by the five levels showing what is measured, who is responsible, what data is collected and how the measures are aligned with strategy. This table can be a guideline to identify where your organization is now and what it needs to do next. The table provides a comprehensive measurement system, but keeps it simple. To make it efficient and effective, start small, make it available to all, and see what gets used. Then improve it. Write a comment if you see additional elements that are missing, or want to ask questions relevant to your organizational situation.
