Not quite! I can’t tell you how many companies I have worked with who announced we have modeled all the current state process or say we want to begin by modeling all their As Is processes. And they ask, can you help us with that? There is nothing wrong with modeling processes, but it takes a long time and it doesn’t produce improvements. Modeling processes is just one of the first steps. I suggest modeling the processes you want to improve and do them in groups of three or one by one. Then analyze each and improve them to see business results.
So if you’ve only done the process diagramming, what do you need to do next? Look at the roadmap below showing the phases of a BPM/ process improvement project.
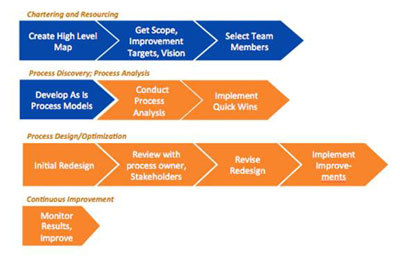
Develop As I Process models is the fourth blue chevron. So if your organization has been doing modeling you need to step back and complete the chartering and resourcing chevrons. For this article, let’s assume you have a charter, with a high level map, scope, improvement targets and vision provided by the executive sponsor and process owner, and a representative team of subject matter experts, and the current state processes modeled. If you haven’t done those initial steps, you had better go back and complete them or your next steps will be more convoluted, take longer, and not get the results you want.
But if you have gotten off to a good start and completed the 4 chevrons in blue. What do you do next?
Next is Conduct Process Analysis. Here there are lots of choices. I can count over 70 analysis techniques and have used many of them, but there are even more. So you have to choose unless you want your project to last 12-18 months just in the analysis and design stages.
The charter will give you the process owner’s and executive sponsor’s improvement targets and those are key for your initial focus. These targets should tell you in what areas the executives want to see improvements, such as the examples below:
- Standardize the budget process. Reduce the 15 different budget processes we currently have to one.
- Increase the accuracy of the data entry inputs from 65% to 95%.
- Reduce the total cycle time from ordering to delivery of medications in the hospital from 18 hours to 2 hours.
The improvement targets outline the critical categories for improvements. You may make many small and large improvements in your project but they better produce the final result articulated by the process owner.
The vision of the process owner gives you another critical focus, often more in the effectiveness arena, vs. the efficiency arena.
A vision for the first improvement target above might be:
- We provide standardized budgets with consistent and accurate data within 2 business days of end of month. A summary of key trends and potential red flags are provided for the department head at the same time.
Combine the improvement targets and the vision and you know that you need to standardize the process, get clear data definitions, do it monthly in a specific time frame, and include some value added summary statements.
So as you begin to consider analysis techniques, start with the four I consider required:
- Swim lane as it models
- Customer scorecards
- Quantitative data
- I-wasted pain points
If you want to read more about these see my blog entitled, “What Analytical Tools Should We use for Our BPM Process?” The four required techniques cover work and information flow, customer needs, objective quantitative data, and employee generated wastes or pain points. If you have applied these analytical techniques you are probably 80% finished with analysis. In fact you can stop if you have a simple process improvement project, and just move on to the design stage.
But if you have a more complex project you will want to consider a few more techniques and see if you should apply any more based on your improvement target. Below is a list of the most important ‘optional techniques’ and their purpose.
| Category | Technique | Purpose of Technique |
| Standardization | Identify sub processes or templates for stabilization Capture several key instances of As Is process diagram, then build one consistent map from all of these. |
Helps to reduce process variation and stabilize steps, sequence, and roles before other improvements are made |
| Time | Notched Time Line Identification of Time Wasters |
Determine bottlenecks and major areas of wait between steps; can provide major improvements in process cycle time |
| Errors | Fishbone diagram; Pareto chart
5 Whys
Supplier Evaluation |
Qualitative and quantitative methods to determine root cause and identify which are critical few to work on first Method to go beyond presenting symptomatic causes and identify root cause, including political and cultural root causes Determine what you need from a supplier, in order to identify specific information and service needs to improve your process |
| Costs | Activity based costing; cost of quality | Find large costs in the process, either by step or errors |
| Roles and Responsibilities | RACI chart | Identify roles for each step in the process to see who is responsible, where there is overlap, too many approvals, where informing would be better than approving or consulting |
| Risk Management | Risk Assessment | Identify risks in the current process and create controls for each |
| Benchmarking and Best Practices | Interviewing other sites or organizations about their process | Determine practices which can be adopted to your process; find ideas which stretch your thinking about what is possible |
Let’s look back at the improvement targets and the vision statement examples and see what they suggest for the other analytical techniques.
The first improvement target about standardization tells us we need to use that technique – standardizing specific templates, sub processes, and possibly the whole process.
The vision example that matches this improvement target suggests we should (1) analyze time and (2) find out what summary statements are value added from the customer’s (department heads) point of view.
The second improvement target tells us we had better be looking at errors – what kind of errors, why they occur, and how do we get at the root cause to eliminate the errors. We probably also need to look at the supplier evaluation to see if suppliers–often including the customer– are giving us complete and accurate data and how we could improve on that.
The third improvement target tells us we should look at time, to see where the time wasters are. That may then lead to another technique to eliminate those time wasters – such as eliminating errors, or standardizing sub processes, or reducing handoffs and approvals.
We have not delved into the final three techniques based on the improvement targets, so let me comment on each of those as well.
Roles and Responsibilities: I use this technique in Analyzing the As Is and in Analyzing the To Be model. It helps to see where you have missing roles, where roles overlap, where you have too many approvals, and where you might need consolidated roles.
Risk Management – There are many types of risks – market, financial, operational, liability, and regulatory to name a few. I use this technique especially with financial, healthcare, or other processes that have regulatory and financial risks. You can use it with the As Is process to find risks and see if there are control points or not. You might also find control points you no longer need (they often come from historical situations which are no longer relevant). If you use this technique with the To Be model you can see if you have introduced additional risks.
Benchmarking and Best Practices – I use this technique as often as time allows. It is very stimulating and eye opening to team members. I find it really helpful before the redesign because it introduces ideas that will encourage team members to think radically. I also use it if an organization wants to know what similar institutions are doing – for example when I am working with a government research lab, they want to know what other labs are doing. This indicates where they stand in the pack.
Yes, there are more analytical techniques but I have covered the key ones. If you need additional ones, Google the topic and you will be able to find examples and instructions. But use the improvement targets and visions to direct you. Don’t just do more techniques to provide more ideas. Always ask yourself, what might I learn from this technique and what action would we take because of it?


