I admit it; I waste hours a week playing video games. On my phone, laptop or tablet; on a train, bus or airplane; when I have time and when I don’t, I and millions like me find that the positive feedback from these games keeps us addicted. A silly banner pops up and says “Congratulations, you’re a winner!”, or tells you you’re still lagging behind the champion, and you just have to play again.
Game designers keep us coming back by knowing the simple behavioral fact that people love metrics. Sports fans keep statistics on their chosen teams and favorite players. Wearable technology manufacturers are cashing in by providing details on miles run per week, hours slept per night, and calories consumed at each meal. Gamblers compare their stack of chips when leave the table to how high it was when they sat down. And we video gamers that have found 40 out of 45 collectables in a hidden object game know that they need to step things up if we’re going to get all of them before the game ends.
Understanding this technique can help employers motivate their employees and teams by showing them consistent performance metrics. Verbal coaching and feedback provides a comprehensive overview of an employee’s contribution; however, seeing the hard numbers of one’s performance improvement (or not) over time leaves no room for subjectivity or differences in management style.
Every company captures Key Performance Indicators (KPIs) for their management reporting, whether they are financial or operational. What employers often miss, however, is the power of exposing these metrics consistently to the workforce to motivate and inspire them. Metrics and measurements may seem unique to each industry, organizational unit, functional team and job, but we can generalize about categories of performance. Some ideas follow.
Process
Processes are measured by effectiveness and efficiency. The first tells us how frequently the process met its stated objective, while the second indicates the amount of cost, time and rework are needed to meet that objective. We should be measuring cycle time, elapsed time, exception instances, and quality against clearly stated targets. The team should have access to comparisons of each of these over time, to gauge for themselves improvements that have been made, or improvements that are needed. Managers should celebrate the former and pull the team together to analyze the root cause of the latter.
Customer Center
Call centers regularly monitor the number of calls per agent, average time of the calls, calls abandoned, time to resolution, trouble or complaint by cause code, and any customer satisfaction metrics captured by after-call surveys. With increasingly sophisticated integration between telephony and computer systems, providing real- or near-real-time graphs and visual feedback to each agent can act as a map to steer them towards better performance. Display team performance for all to see.
Web Presence
Whoever is in charge of keeping the company’s ordering, marketing or transactional websites on line should of course know the precise minutes that sites are down. In addition, they must track time that any features or functions were unavailable, slow, or not providing responses as expected. Graph improvements or declines week over week, month over month, and year over year to keep the Operations team motivated to beat their own records.
Financials
Some firms are reluctant to expose financial metrics to employees, and in some cases this makes sense. If this is the situation, the targets and performance against them can be abstracted without values to give employees a sense of where the team is meeting, exceeding or falling short of expectations.
Tips
No matter what form the goal takes, make sure that current progress towards goals are highlighted. Don’t wait until they are met or missed to provide this feedback. A very visible display of where the team, department and company is as of today, this week and this month should be available to everyone. Individuals should also have a way to determine their own progress to goals, although this should be confidential for each employee.
Consider the simple charts below to display the metrics and measures.
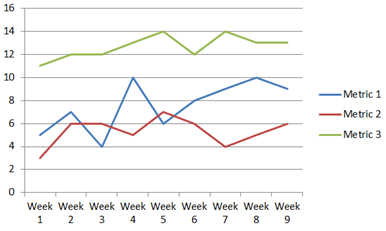
Time Series: Today or this week, month or year compared yesterday, last week, month or year. If there are more than three dimensions to show, a time series with trends can be shown with a simple line graph.

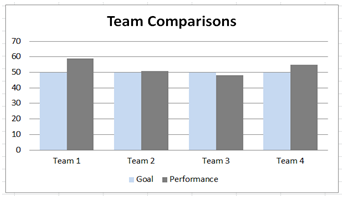
Comparison to Target: If there are multiple teams, show a bar graph of performance for each against goal.

Sparklines: Where there is more than one metric and scales are disparate, use over/under spark lines. These can be a in time series, as show below, or for team comparisons.

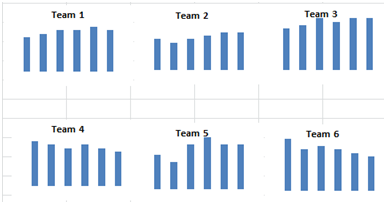
Small Multiples: Another way to display multiple metrics is to compare them in small graphs near each other.

Conclusion
The metrics being used to manage your business are powerful motivators that will tap into your employees’ need to win. Design your metrics to display them on a regular, ongoing cycle to motivate and train employees, and for analysis. Everyone wants to know the score. Be sure your company can win the game using metrics.


